Employment work
Rely
Next.js, Go, WebSockets, Tailwind v4
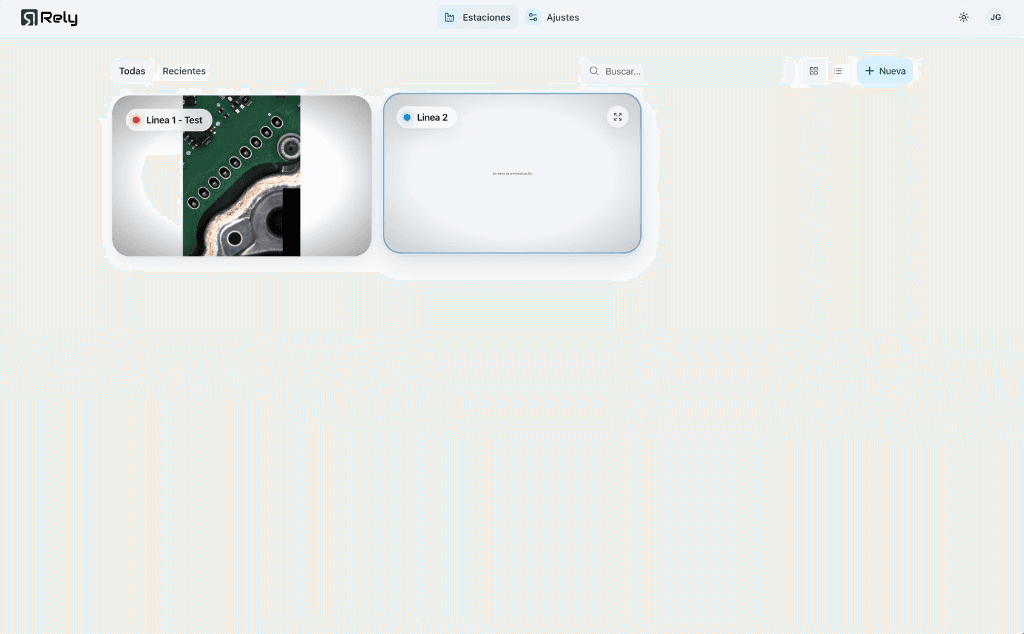
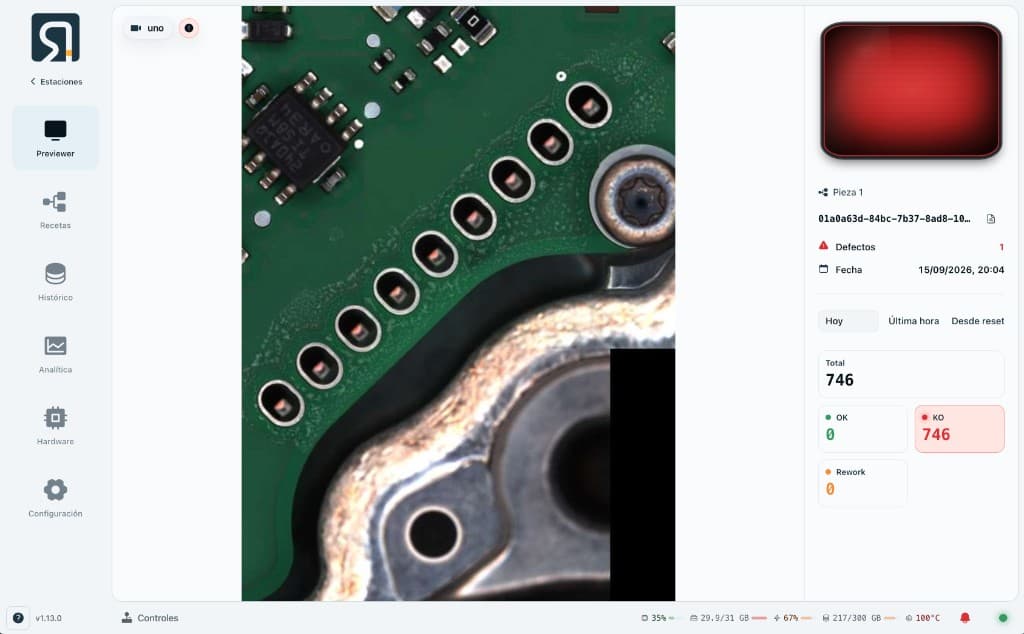
A Hub of Stations: live Preview with an OK/KO on the piece, and a Recipe graph engineers deploy to the floor.
Decisions
1. The Station is the product
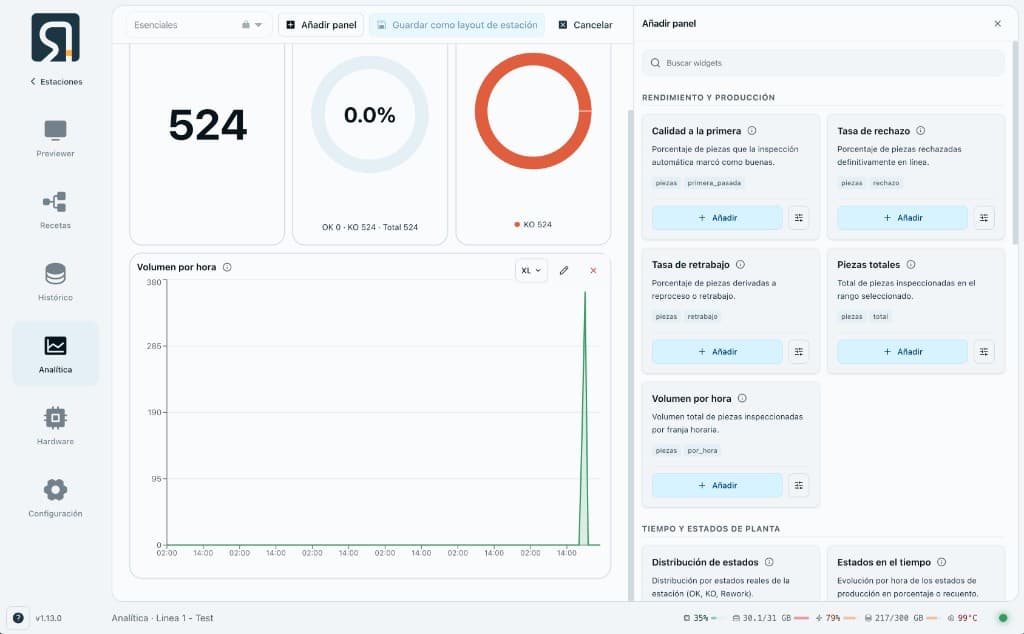
The Hub is a list of Stations, not a model zoo. Opening one is the floor: live camera, piece identity, OK/KO. The operator reads a verdict. Recipes, overlays, and analytics sit beside that surface — they do not replace it.
2. A Recipe is a graph you deploy
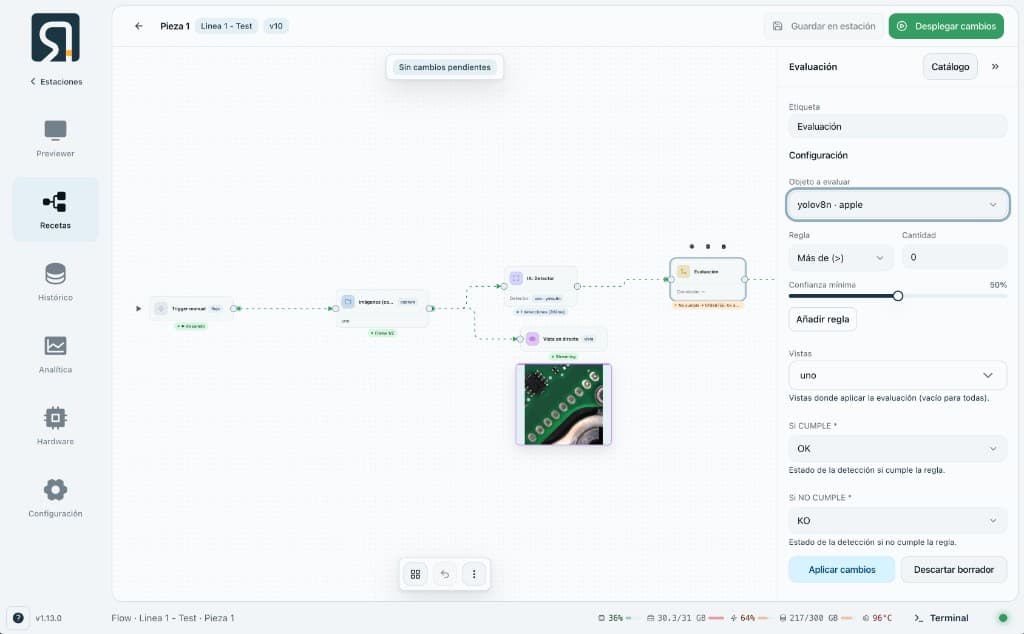
Inspection is not a script per line. Trigger → images → detect → Evaluación is a visual flow with a contextual inspector. Evaluación is a rule on detections (count, confidence) that writes a station status: OK if it holds, KO if it does not. Deploy publishes the Recipe; the canvas draft is not what the floor is running.
3. Overlays are the operator language
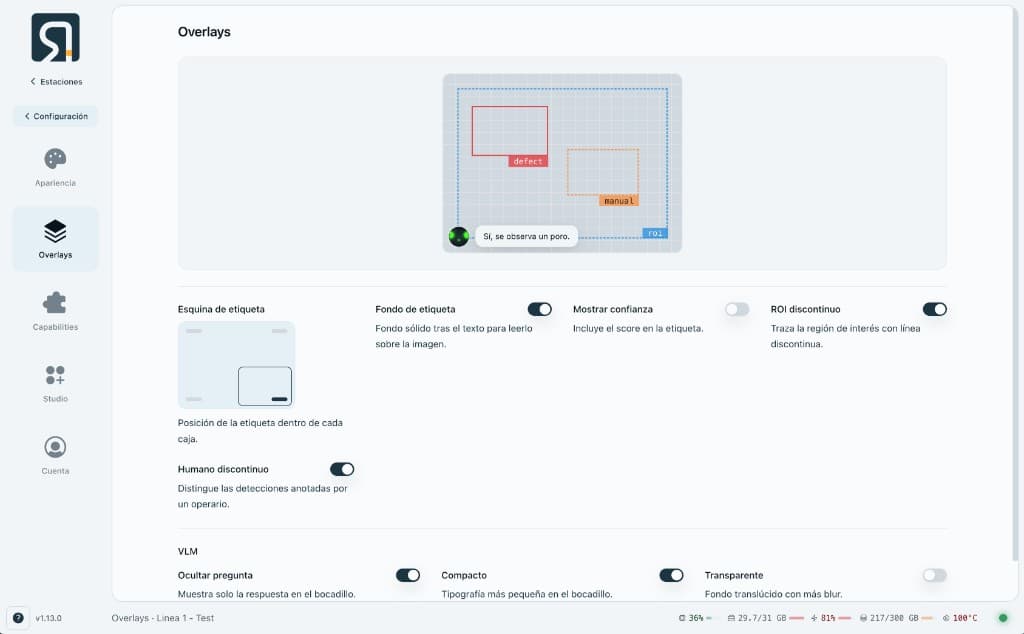
Detections have to be readable on the image: label corner, dashed ROI, human vs model. That overlay is configured per Station so Preview and review share the same picture language — status is the color, not the class name.
Result
In production on factory floors, multi-tenant / multi-site. Hub in the cloud, an agent per Station on the line.
Proof